Sam Hashemi is confronting one of life’s great quandaries with a map.
“I have an 18-month-old kid, so for the first time I’ve been thinking about schools and where we should live and should we buy a house,” says Hashemi, CEO of the online mapping platform Felt.
Accordingly, he’s created a map to help figure out what to do, plotting work locations for himself and his wife, the locations of optimal schools, and homes on the market that fit the family’s needs. “We have been scouting 30 or 40 different places,” he says. “We’re probably going too deep. But when you build mapping software, you go too deep.”
Felt was created for just this kind of problem. With a user-friendly design and interface and a subtly powerful array of professional-grade geospatial information tools, Felt is intended to make it easy to turn any type of space-based information into a clean and shareable map.
From graphic design to databases and spreadsheets to online interface design, once sophisticated computer processes have in recent years been transformed into the play space of amateurs by barrier-lowering startups. Easy to use platforms like Canva, Airtable, and Figma allow people with little to no background or technical training to quickly create designs, databases, and web tools that look and function professionally.
Hashemi is hoping Felt can do the same for the data-drenched and software-reliant world of custom mapping. A new version of this mapping startup’s web-based tool has just launched, and its features aim to put the power of mapping into the hands of both amateurs and professionals, enabling them to create custom, complex, and collaborative maps through a simple online interface. Scientists can use it to monitor habitat loss, for example. Urban planners can use it to analyze population dynamics and zoning issues. New parents like Hashemi can use it to bull’s eye that Venn diagram of a suitable home and a decent school.
Felt’s new features are like a mix between the ultra-accessible mapmaking features inside Google Maps and the high-end enterprise software used to create and analyze mapped information, known as geographic information systems (GIS). By combining low-brow accessibility and high-brow geospatial data tools and analysis, Felt is trying to bring mapping to the masses. It’s already being used by organizations like the Washington Post to report on the war in Ukraine, universities like Cornell, and even activists working to make safer streets.
Hashemi has a deep background in using design to improve the function of arcane and unwieldy technologies. He worked for NASA updating 1990s era systems on the International Space Station, as well as for the Department of Energy. Later he co-created an urban planning and visualization tool called Remix that was used by major cities around the world and eventually acquired for $100 million in 2021.
While running Remix and working with city governments, Hashemi noticed a familiar trend from his days working as a designer in federal agencies. Cities had deep wells of knowledge and information about themselves—in this case, in the form of maps—but few ways to easily make that information actionable across departments. “They’d have these giant files, often gigabytes in size, and would end up taking awkward screenshots and sending them place to place,” says Hashemi. The GIS professionals in these cities, who are in charge of everything from mapping sewer lines to analyzing resident access to public services, were reliant on dense software like ArcGIS and QGIS that few outside their departments could engage with.
Hashemi says Felt was founded to create a more approachable alternative, akin to what platforms like Canva and Figma have done. “They’ve taken things that were only enterprise and made them much more accessible through a new generation of design principles and design tooling,” says Hashemi.
Felt put mapping online, making it easy for users to create their own maps, add new data points, and share the results with others. It’s used by more than 20 different industries, from cities to disaster response organizations to construction companies. The new version of Felt that’s just been released bends towards enterprise use, while keeping its user interface straightforward enough for beginners.
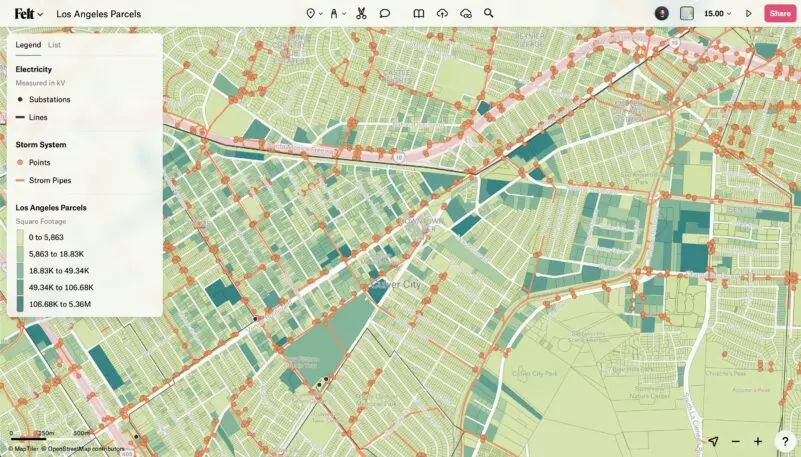
One part of making mapping more accessible is making its requisite and huge data files less cumbersome to display. The biggest and most essential piece of that data pile is the base map, which includes the most basic outlines of the world’s territories, from national borders to natural land features to street names. Thanks to the open source mapping project OpenStreetMap, this dense global base map is freely available in the cloud, and automatically loaded within Felt.
Also automatically included are more than 300 public data sets covering everything from sea level rise to earth surface temperatures to topography. A click of a button draws up this information immediately, sidestepping the hours it might take to populate a map with gigabytes worth of spatial data.
Felt’s new “upload anything” tool expands on this accessibility, making it easy for users to dump in files with nearly any form of geospatial data and have it quickly converted into points on a map with remarkable accuracy.
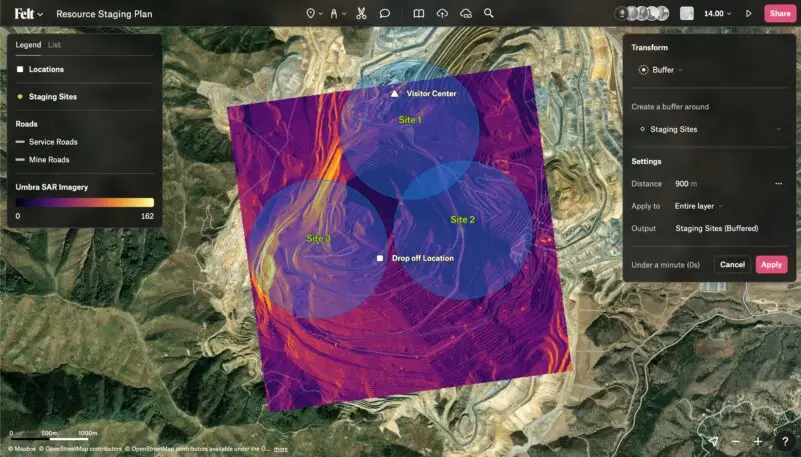
The other key feature of Felt 2.0 is the ability to do spatial analysis, precisely the kind of high-brow processing a GIS professional would do with complex enterprise software. Using Felt’s tools, a user could ask which farmlands in a specific geography are producing the most crops, or what buildings in a county were damaged by a wildfire, or which neighborhoods in a city are experiencing certain types of crimes. These seemingly straightforward questions, of course, rely on significant amounts of data and require large amounts of computing power. “One of the hardest bits about doing spatial analysis in the past is it’s very slow,” Hashemi says. “These things can often take hours or days to run because there’s a huge amount of computation required.”
Felt is lowering the barrier to this kind of analysis by storing its data on the cloud and tapping huge server farms to process data-heavy requests. “We can spin up a huge amount of servers on demand to greatly accelerate how long it takes to compute,” says Hashemi.
Some early users have applied these capabilities to analyze wildfires, understand social vulnerability in Washington state, and parse crime reports in Denver. And, in Hashemi’s case, look for a house.
Hashemi’s house-and-school hunt is maybe one of the less advanced maps Felt has been used to make, but he says that’s sort of the point. People can use maps to answer all sorts of questions or understand a wide range of real world conditions. Giving them an easy way to create those maps will help more people wrap their heads around both the trivialities and the complexities of life.
Recognize your brand’s excellence by applying to this year’s Brands That Matter Awards before the early-rate deadline, May 3.