Methodology for 2014 Smart Cities Benchmarking
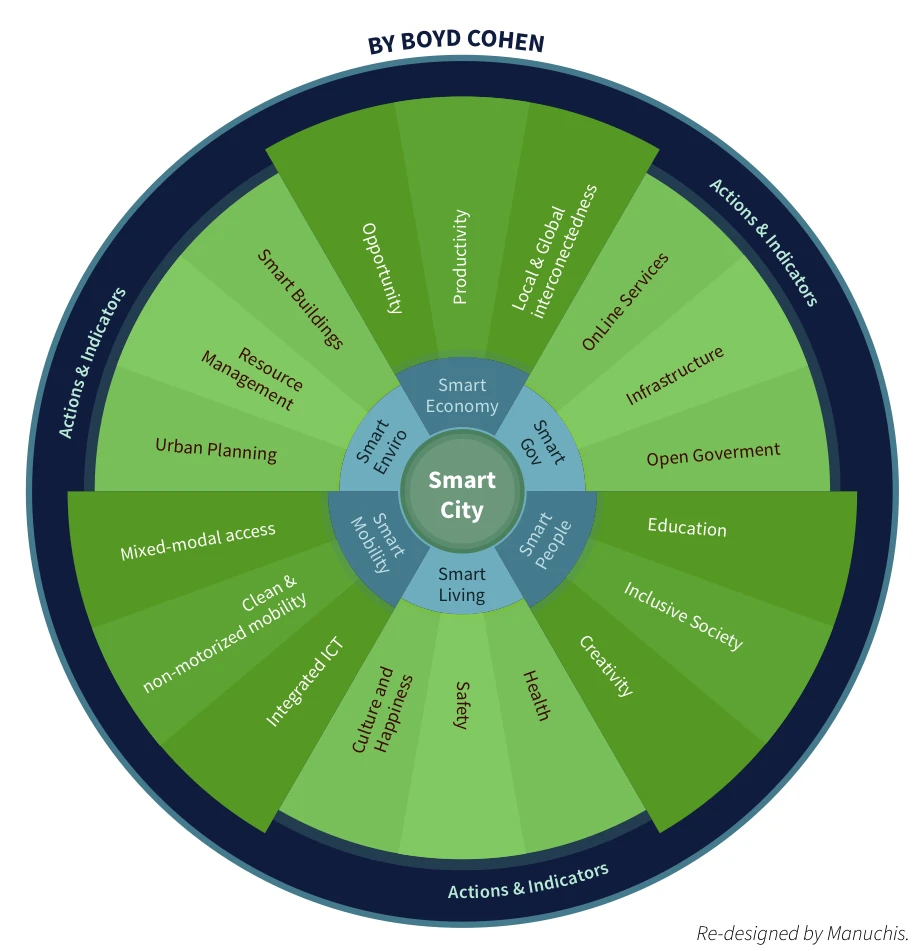
I have been ranking smart cities since 2012, leveraging the smart cities wheel (left) as a framework for understanding six key components of a smart city. The early rankings were done with mostly publicly available data and last year, we published here, regional rankings which combined publicly available data (i.e. secondary data) with data collected directly from eligible cities (primary data) around the globe.
However, the ranking left everyone wanting in that it did not have enough depth to accurately benchmark smart cities with enough specificity to add value to city planning. So I went back to the drawing board and developed a global advisory committee made up of Rick Robinson (Executive Architect for Smart Cities at IBM), Pilar Conesa (Director of the Smart City Expo), Jesse Berst (Founder of the Smart Cities Council) and Esteve Almirall, (Director of the Center for Innovation in Cities at ESADE business school in Barcelona) to help further refine the rankings
It is never easy determining the correct number of indicators to use for such a significant task like benchmarking smart cities, which is a very complex concept. While I have co-developed a list of up to 400 potential indicators, I try to keep the number manageable. Last year I attempted to collect data on 28 indicators across the Smart Cities Wheel. In collaboration with the advisory committee, we raised that number to 62. You can see them all here:

Of the 62, 16 of them are also directly mapped to the new sustainable cities ISO standard (ISO 37120). In contrast with years past, in this iteration, I sent the spreadsheet containing the 62 indicators to my contacts in 120 eligible cities around the globe (30 cities in each of the following regions: Europe, North America, Latin America and Asia Pacific).
As can be expected, the volume of indicators I sent is challenge for cities to collect. One would hope in the future that smart cities will improve their ability to collect this type of data (and in some cases generate the data in real time) given that a part of the goal of smart cities is to be transparent and to make use of the Internet of Things and ubiquitous sensors in order to make better decisions grounded in quality information. For now, however, it is still a challenge for most cities and as such only 11 of the 120 eligible cities around the globe managed to respond to the survey.
Specific Methodology
Each of the six components of the Smart Cities Wheel are assigned a set of indicators reflect an attempt to create a proxy for measuring each of the sub-components of the Wheel. Each component contains 3 subcomponents. Therefore there are 18 total subcomponents in the model, and with 62 indicators, that leaves an average of almost 3.5 indicators per subcomponent. Using the data I received from each of the 11 cities, I transformed the data using a mathematical formula called a z-score, which permits the comparison of data in different units (e.g. %, tons of GHG emissions, etc.). Each of the 6 components are then assigned a maximum of 15 points and the results are transformed in a way that the highest performing city in each category is assigned 15 points. Thus, if one city were to lead in each of the six components, the city would obtain a maximum score of 90 points.
Given the difficulties cities had in responding to this survey, we will need to rethink the methodology going forward. The hope is to have as many cities (large and small) from around the globe participating in a way that permits them to benchmark themselves against other similar cities, and of course, to facilitate knowledge sharing amongst the private sector and citizen groups.
Recognize your brand’s excellence by applying to this year’s Brands That Matter Awards before the final deadline, June 7.
Sign up for Brands That Matter notifications here.
