After a pandemic that put the gaps in society into life-and-death terms, these visualizations show how some people have thrived over the last year, while others’ financial situation has—at best—stagnated.
Even early on in the pandemic, it was clear that the economic effects of COVID-19 shutdowns would not affect everyone equally. Instead, they highlighted stark inequalities in our world, with some people working safely at home and ordering all their groceries and food delivered, while others went to work each day at great risk of exposure to the virus. Nearly two years later, that hasn’t changed. Ten charts from Inequality.org, a project of the progressive think tank Institute for Policy Studies that tracks inequality-related news, help paint the picture of the state of economic inequality in 2021.
“My aim with these 2021-in-review charts was to use data to sum up the major inequality trends of the year, looking at both the top and bottom of the income scale and through racial, gender, and global lenses as well,” says Sarah Anderson, global economy project director at the institute and Inequality.org coeditor. “I also knew I wanted to end on an upbeat note, since we all need inspiration these days.”
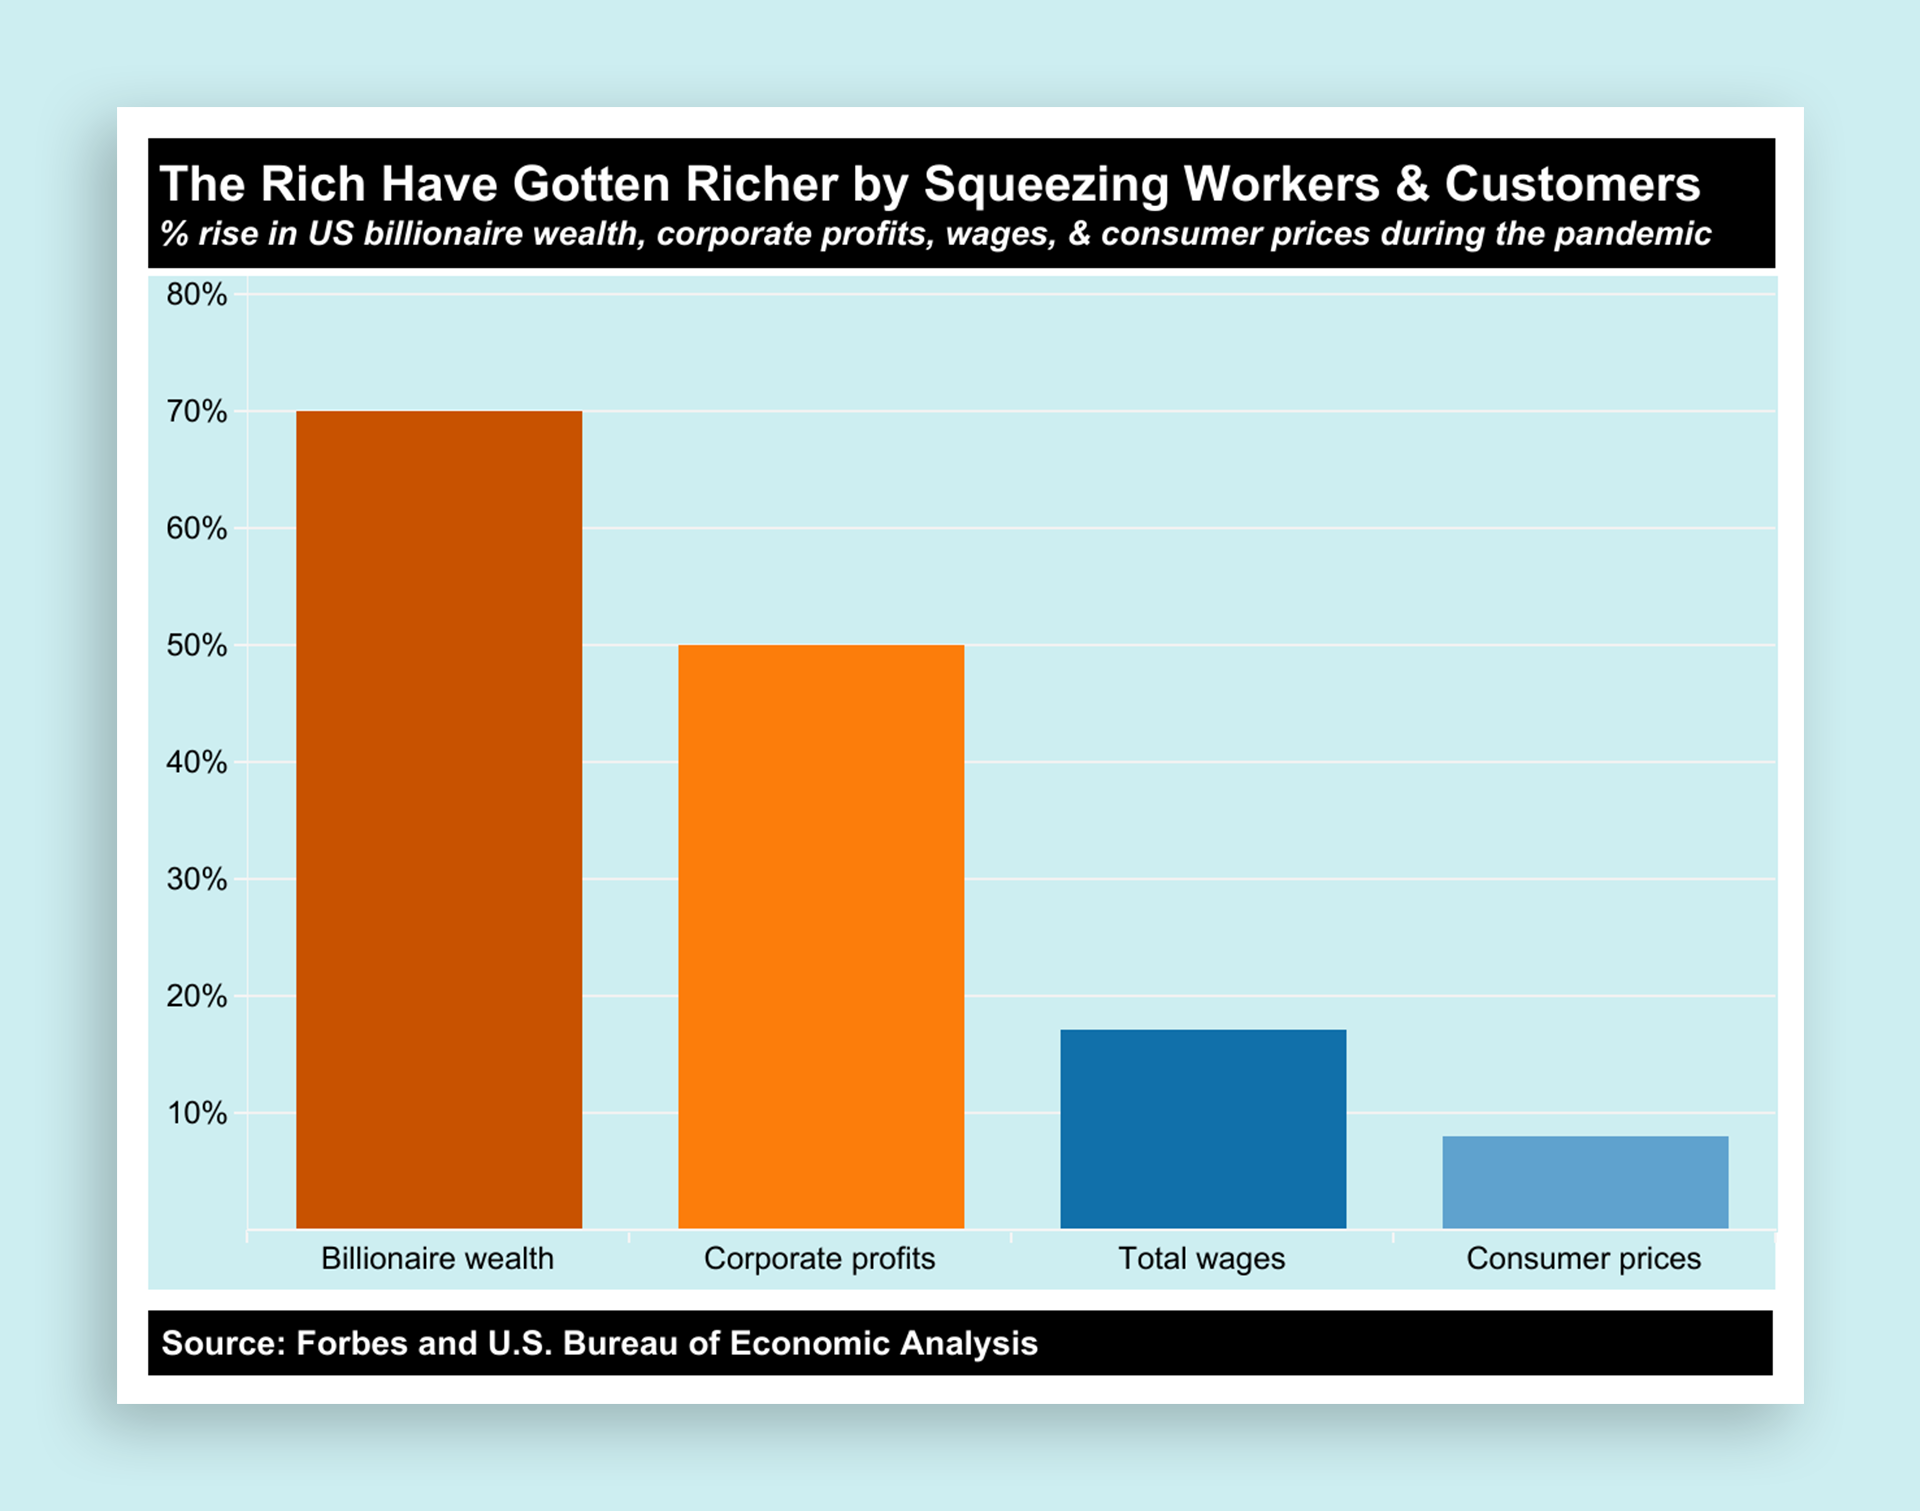
[Image: Inequality.org]The first lays out the rise in billionaire wealth, corporate profits, total wages, and consumer prices since the beginning of the pandemic. While billionaire wealth rose 70% (driven by a surging stock market), and corporate profits rose 50%, wages have only gotten 17% higher since the start of the pandemic. Consumer prices are 8% higher; inflation has effectively taken a bite out of the small raise workers saw.
“The first chart says it all about the lack of shared sacrifice during the pandemic,” Anderson says. “At a time when many people hold the view that staffing shortages are the result of ‘nobody wanting to work anymore,’ it’s important to present the facts about what a raw deal low-wage frontline workers are still getting, despite their heroic efforts during the pandemic.”
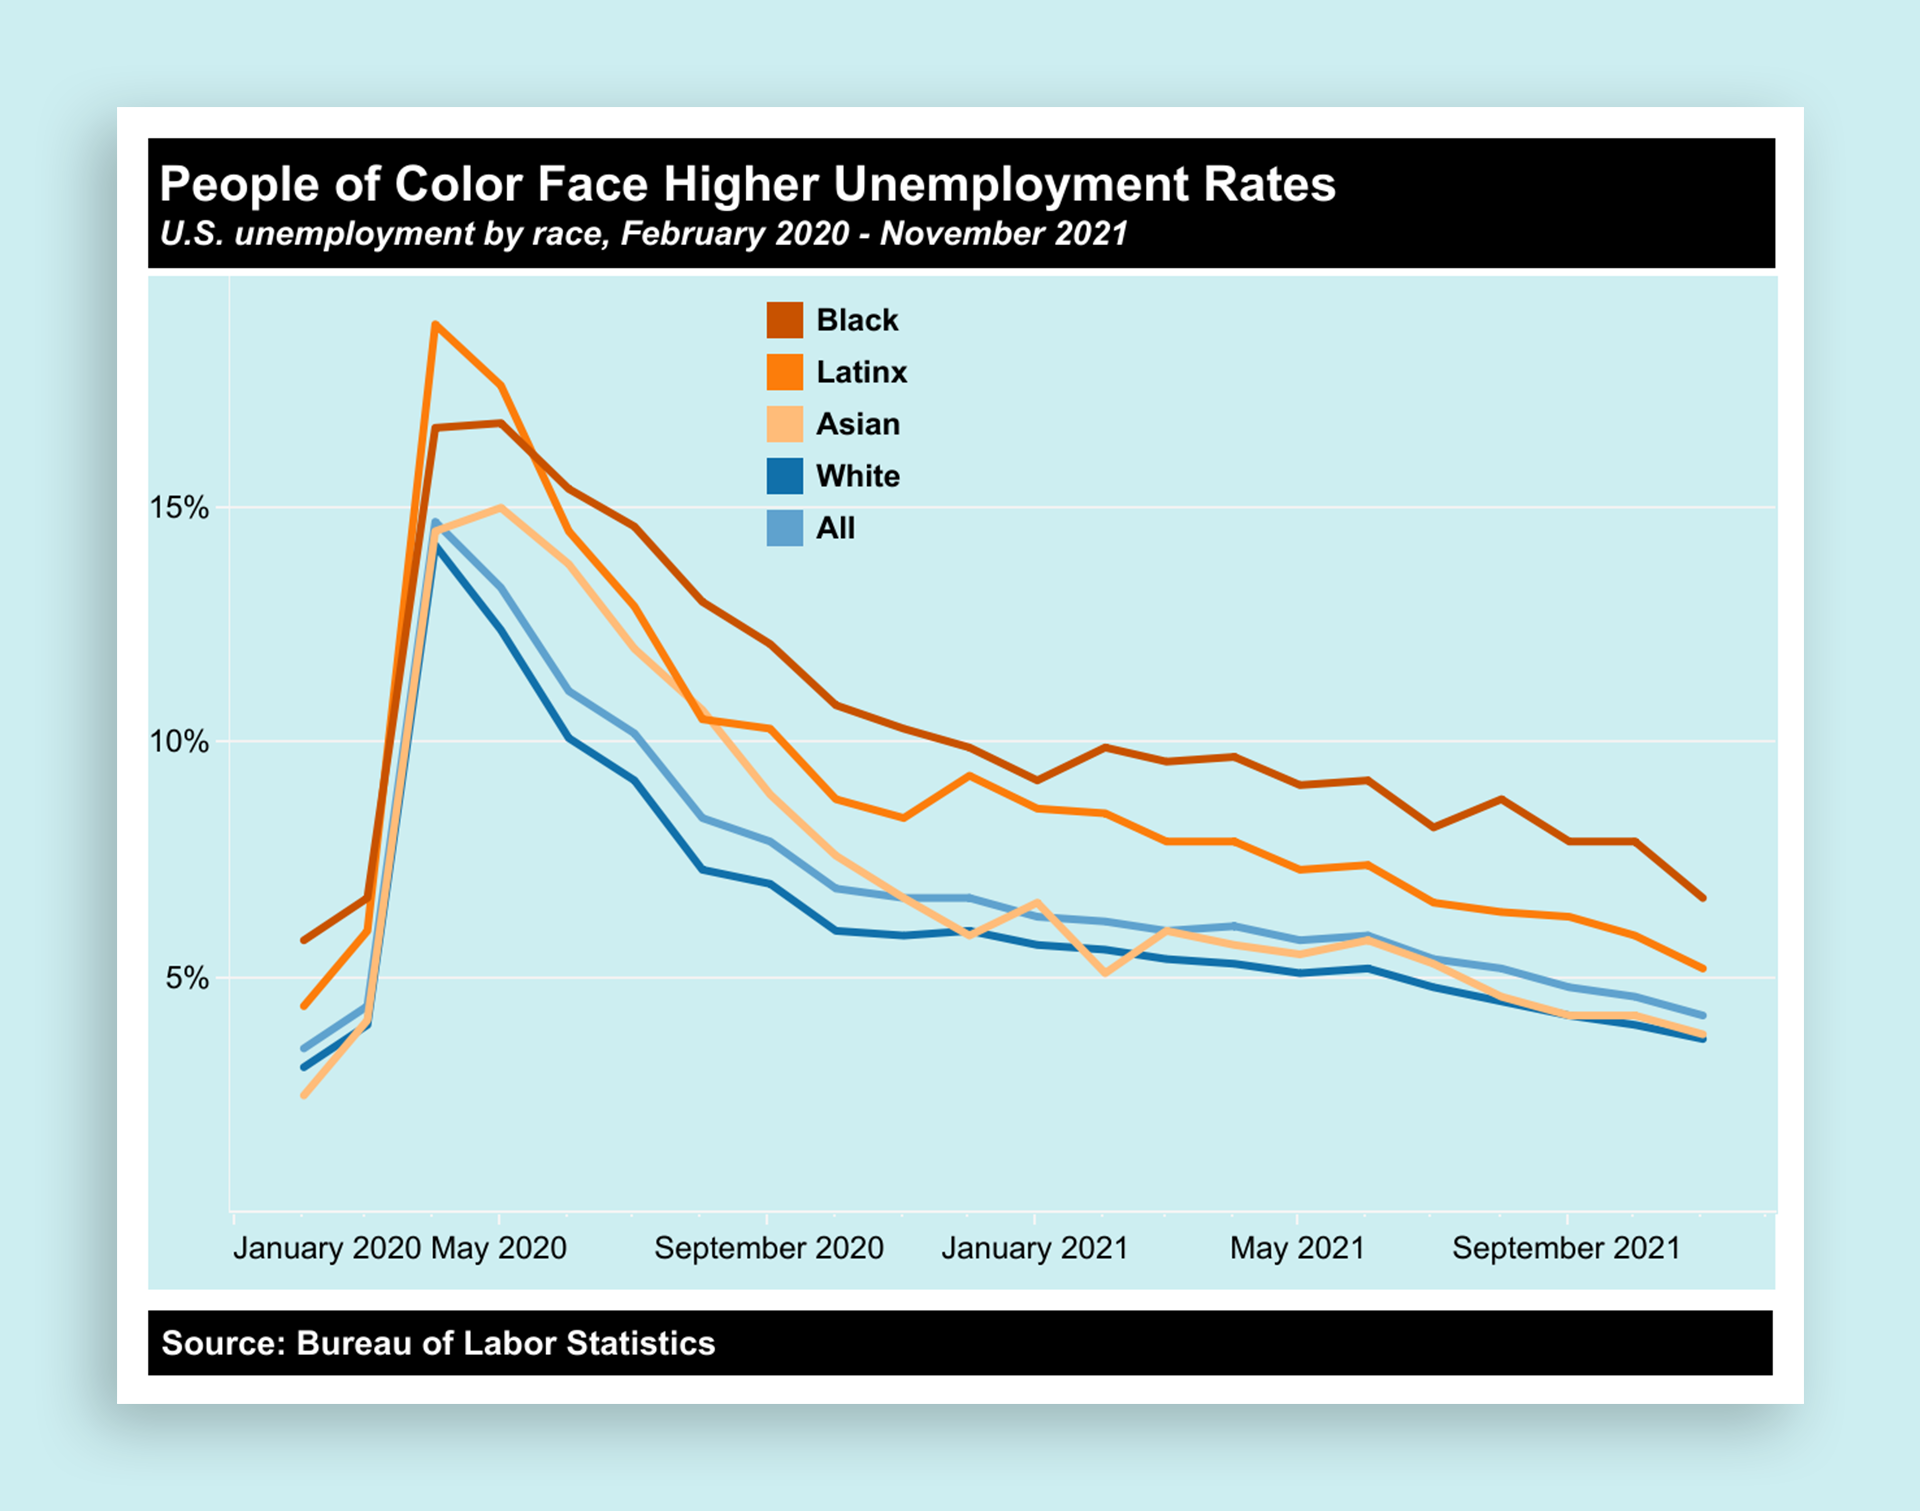
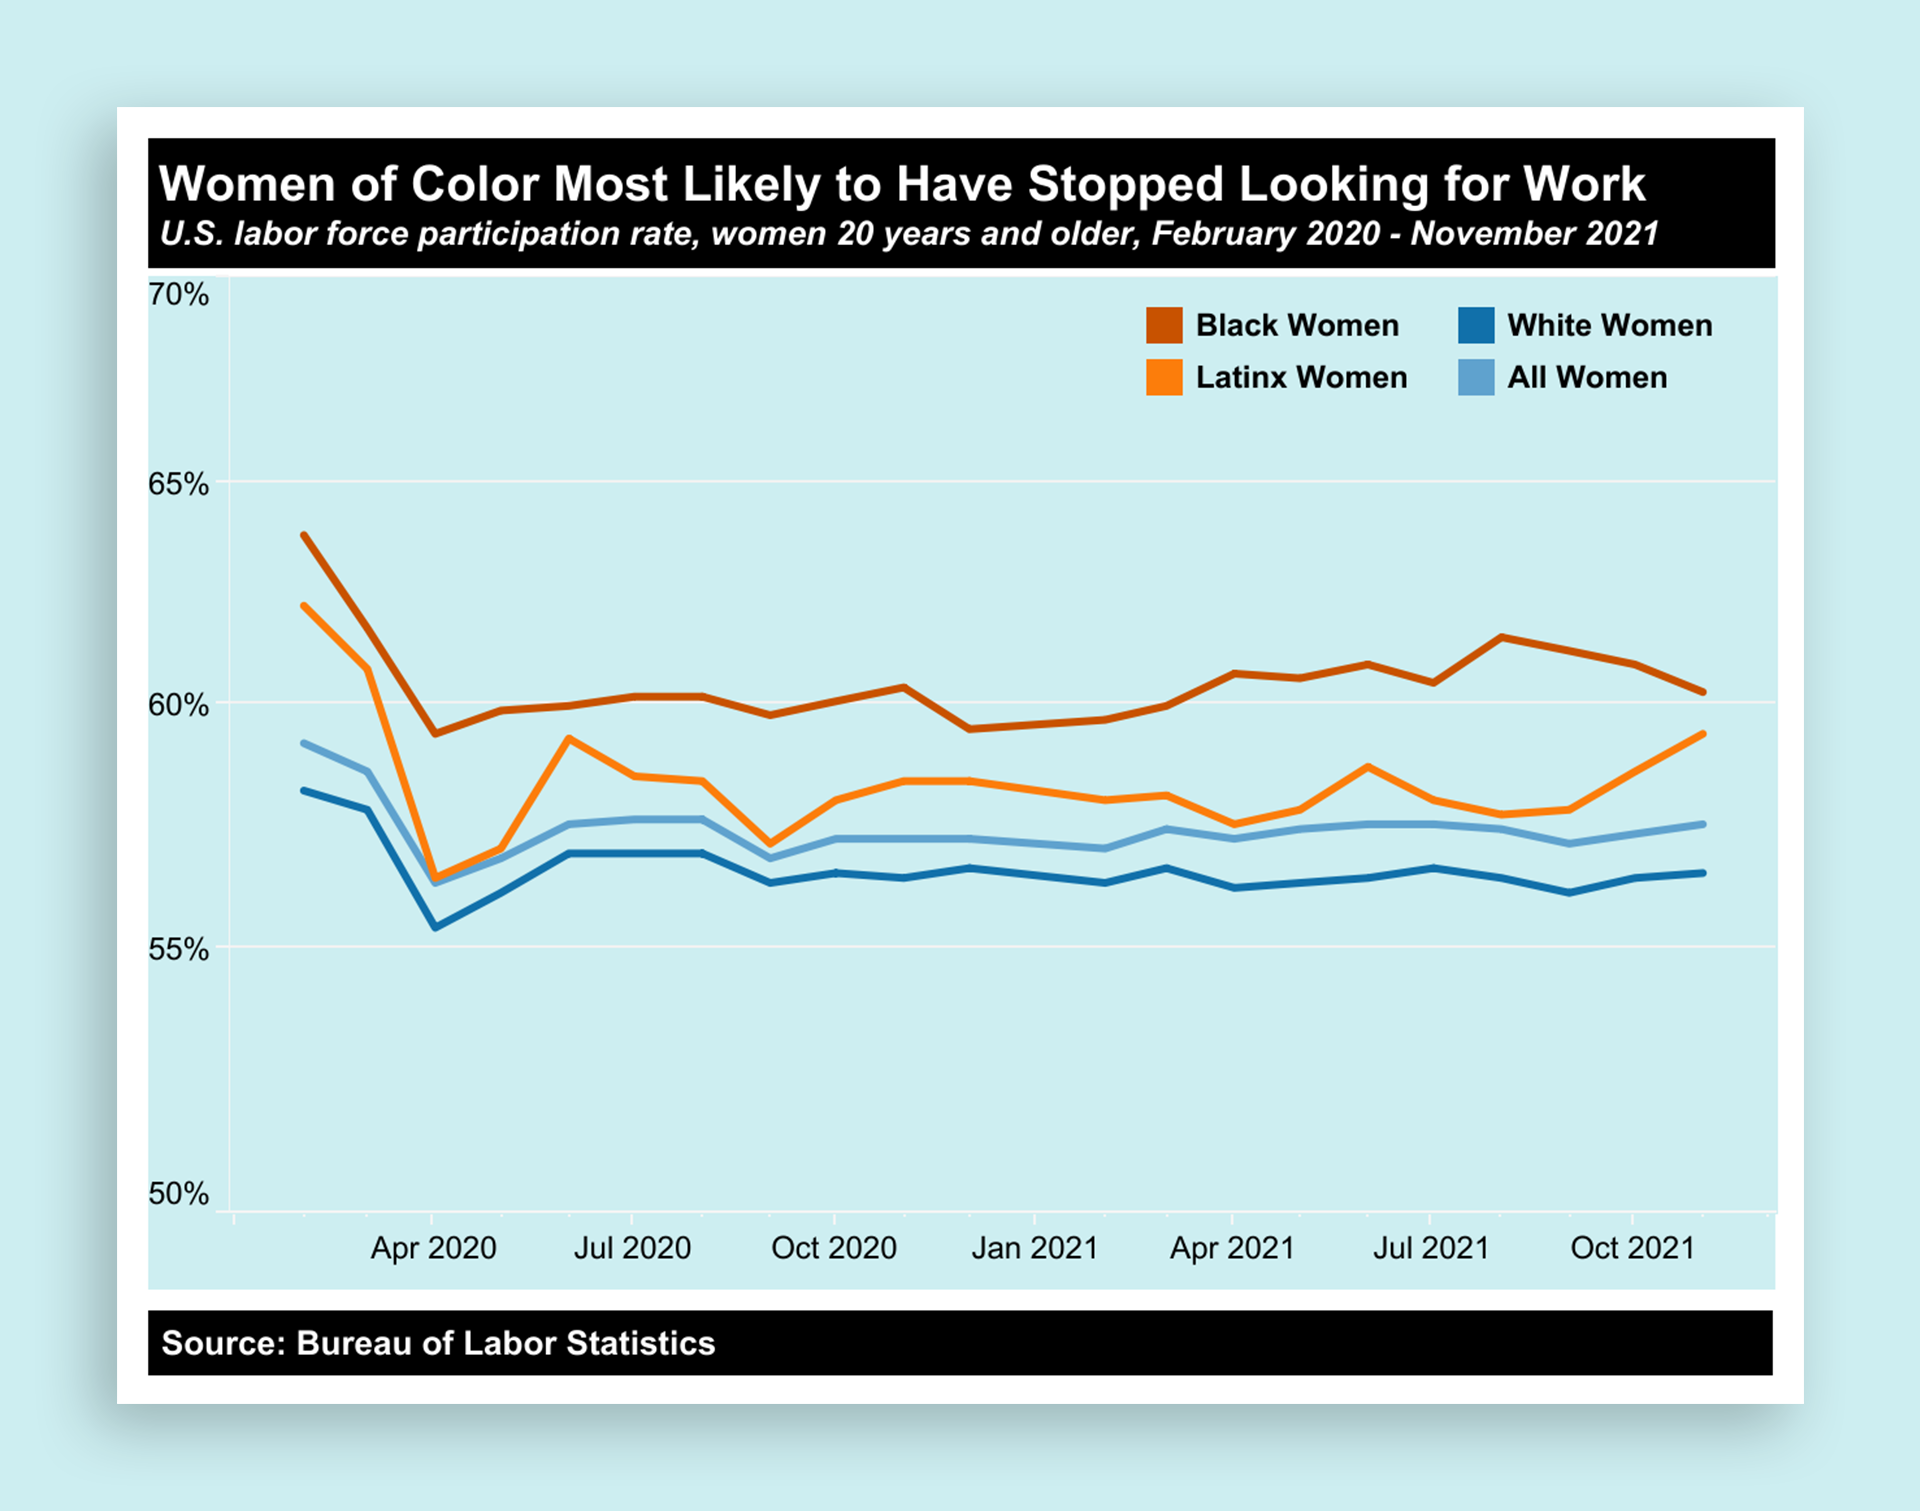
[Image: Inequality.org]Other charts show how people of color faced higher unemployment rates throughout the pandemic—as of November 2021, the unemployment rate among Black Americans was 6.7%; among white Americans, it was 3.7%. Women of color have been affected even more, as the ones most likely to have stopped looking forwork, another chart shows, likely a result of the high cost ofchildcareand health concerns.
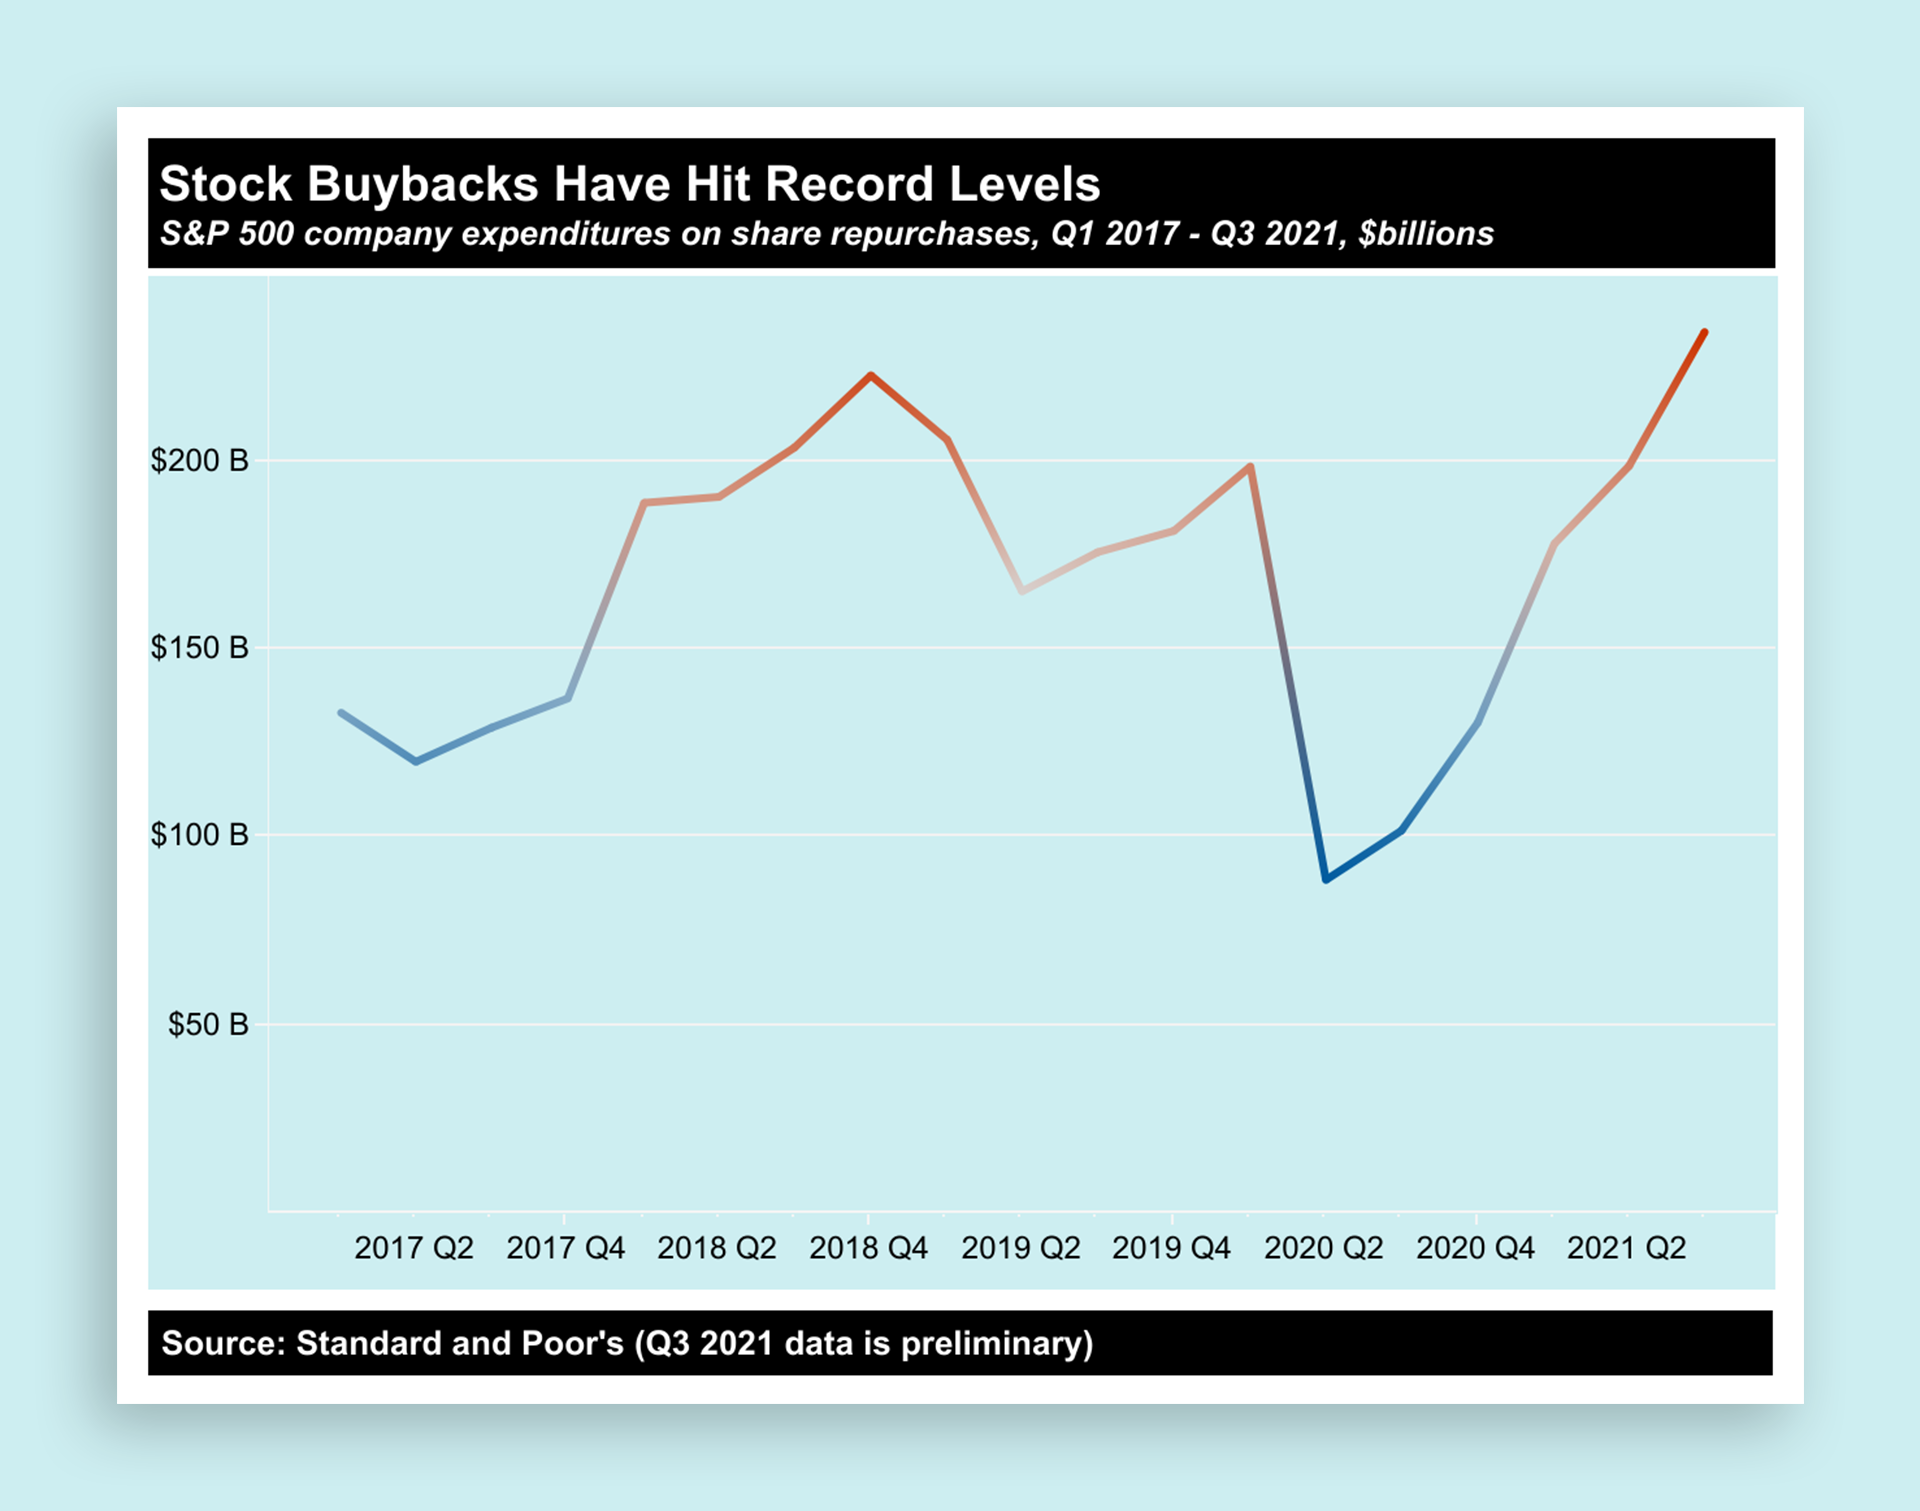
[Image: Inequality.org]Others illustrate how stock buybacks have hit record-high levels, which works to inflate executive’s stock-based pay, and thedisparity of vaccine distributiondepending on how wealthy a country is (148.9 doses administered per 100 people in high income countries versus just 8.1 per 100 people in low-income ones).
“Several of the charts are also aimed at making the case for the public investments in the Build Back Better legislation,” Anderson adds. “The job creation parts of the bill would address the high unemployment rate among people of color and the childcare investments could help more women, particularly Black women, return to work.”
[Image: Inequality.org]Thoughthe bill currently seems dead, some of its provisions could be reintroduced, and Anderson says they could reduce income inequality, thanks to tax increases, including a surtax on annual incomes above $10 million, one chart shows. Another chart details how those taxes on the ultrarich would raise $230 billion, enough money to cover public investments like universal preschool and more affordable housing. Those surtax changes would likely hit corporate CEOs, a group whose pay hasincreased dramaticallycompared to their workers, illustrated by a chart that shows average CEO pay rising this year by 15%, to $13.9 million, contrasted with the trends in worker pay, which increased from $30,416 in 2019 to $30,474 in 2020.
Recognize your brand’s excellence by applying to this year’s Brands That Matter Awards before the early-rate deadline, May 3.
A refreshed look at leadership from the desk of CEO and chief content officer Stephanie Mehta
Kristin Toussaint is the staff editor for Fast Company’s Impact section, covering climate change, labor, shareholder capitalism, and all sorts of innovations meant to improve the world. You can reach her at ktoussaint@fastcompany.com.More