Fast company logo
|
advertisement

Called Dynamic World, it uses AI to analyze satellite data collected every two to five days.

[Images: Google]

BY Adele Peters2 minute read

The planet changes quickly: More than half a million acres are burning in New Mexico. A megadrought is shrinking Lake Mead. The Alps are turning from white to green. Development continues to expand, from cities to massive solar farms. All of these changes impact the Earth’s climate and biodiversity. But in the past, such changes have been difficult to track in detail as they’re happening.

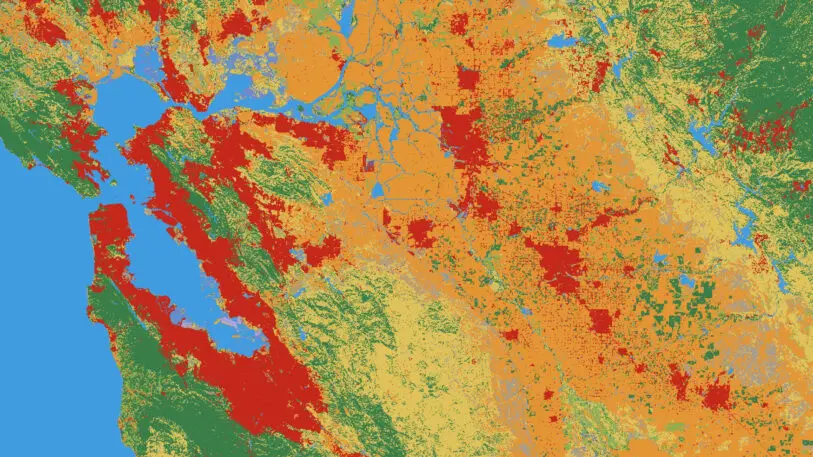
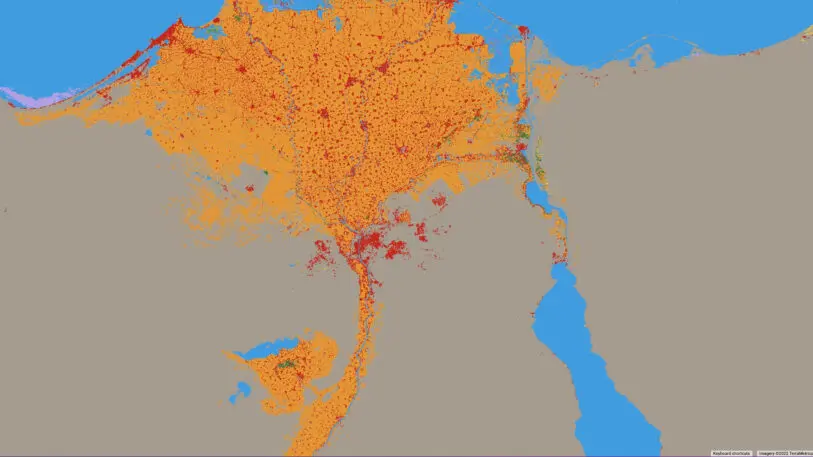
Okavango Delta [Images: Google]A new tool from Google Earth Engine and the nonprofit World Resources Institute pulls from satellite data to build detailed maps in near real time. Called Dynamic World, it zooms in on the planet in 10-by-10-meter squares from satellite images collected every two to five days. The program uses artificial intelligence to classify each pixel based on nine categories that range from bare ground to trees, crops, and buildings.

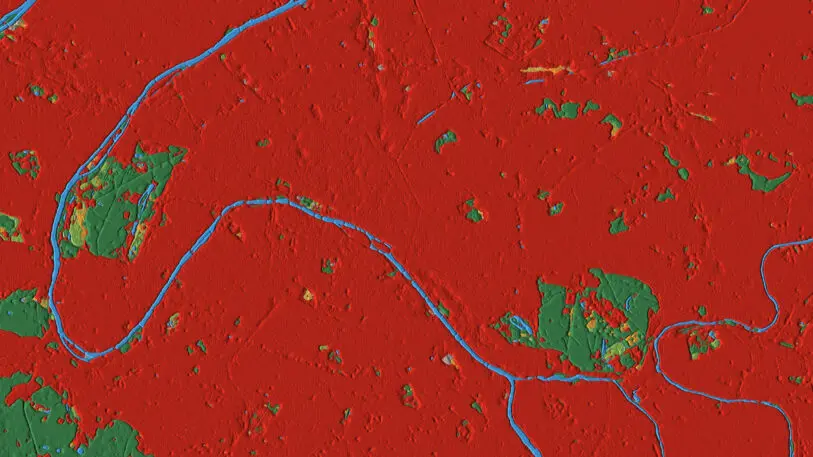
Researchers, nonprofits, and other users can “explore and track and monitor changes in these terrestrial ecosystems over time,” says Tanya Birch, senior program manager for Google Earth Outreach. As the tool was being built last year, Birch used it in the days after the Caldor Fire, a wildfire that burned more than 200,000 acres in California. The pixels in satellite images quickly changed from being classified as “trees” to “shrub and scrub.”

Caldor Fire [Image: Google]Scientists used to rely on statistical tables that were sometimes released only every five years, says Fred Stolle, deputy director of the World Resources Institute’s Forests Program. “That’s clearly not good enough anymore,” he says. “We’re changing so fast, and the impact is so fast, that satellites are now the way to go.”

San Francisco Bay [Image: Google]
Researchers and planners already use satellite data in some applications—the World Resources Institute, for example, previously worked with Google to build Global Forest Watch, a tool that can track deforestation using satellite images. But the new data is much more detailed; now it’s sometimes possible to see if one or two trees are cut down in a tropical forest, even when a larger area is intact, Stolle says.

Nile Delta [Image: Google]
In cities, planners could use the data to easily see which neighborhoods don’t have enough green space. Researchers studying smallholder farms in Africa could use it to see the impacts of drought and when crops are being harvested. Because the data is continuously updated, it’s also possible to watch the seasons change throughout the year across the entire planet. The data goes back five years, and using the new tool, anyone can enter date ranges to see how a location has changed over time.

Paris [Image: Google]
“I encourage people to dive into it and explore,” Birch says. “There’s a lot of depth and a lot of richness in Dynamic World. . . . I feel like this is really pushing the frontier of mapmaking powered by AI in an incredibly novel way.”

Recognize your brand’s excellence by applying to this year’s Brands That Matter Awards before the early-rate deadline, May 3.

ModernCEO Newsletter logo
A refreshed look at leadership from the desk of CEO and chief content officer Stephanie Mehta
This site is protected by reCAPTCHA and the Google Privacy Policy and Terms of Service apply.
Privacy Policy

ABOUT THE AUTHOR

Adele Peters is a senior writer at Fast Company who focuses on solutions to climate change and other global challenges, interviewing leaders from Al Gore and Bill Gates to emerging climate tech entrepreneurs like Mary Yap. She contributed to the bestselling book "Worldchanging: A User's Guide for the 21st Century" and a new book from Harvard's Joint Center for Housing Studies called State of Housing Design 2023 More


Explore Topics