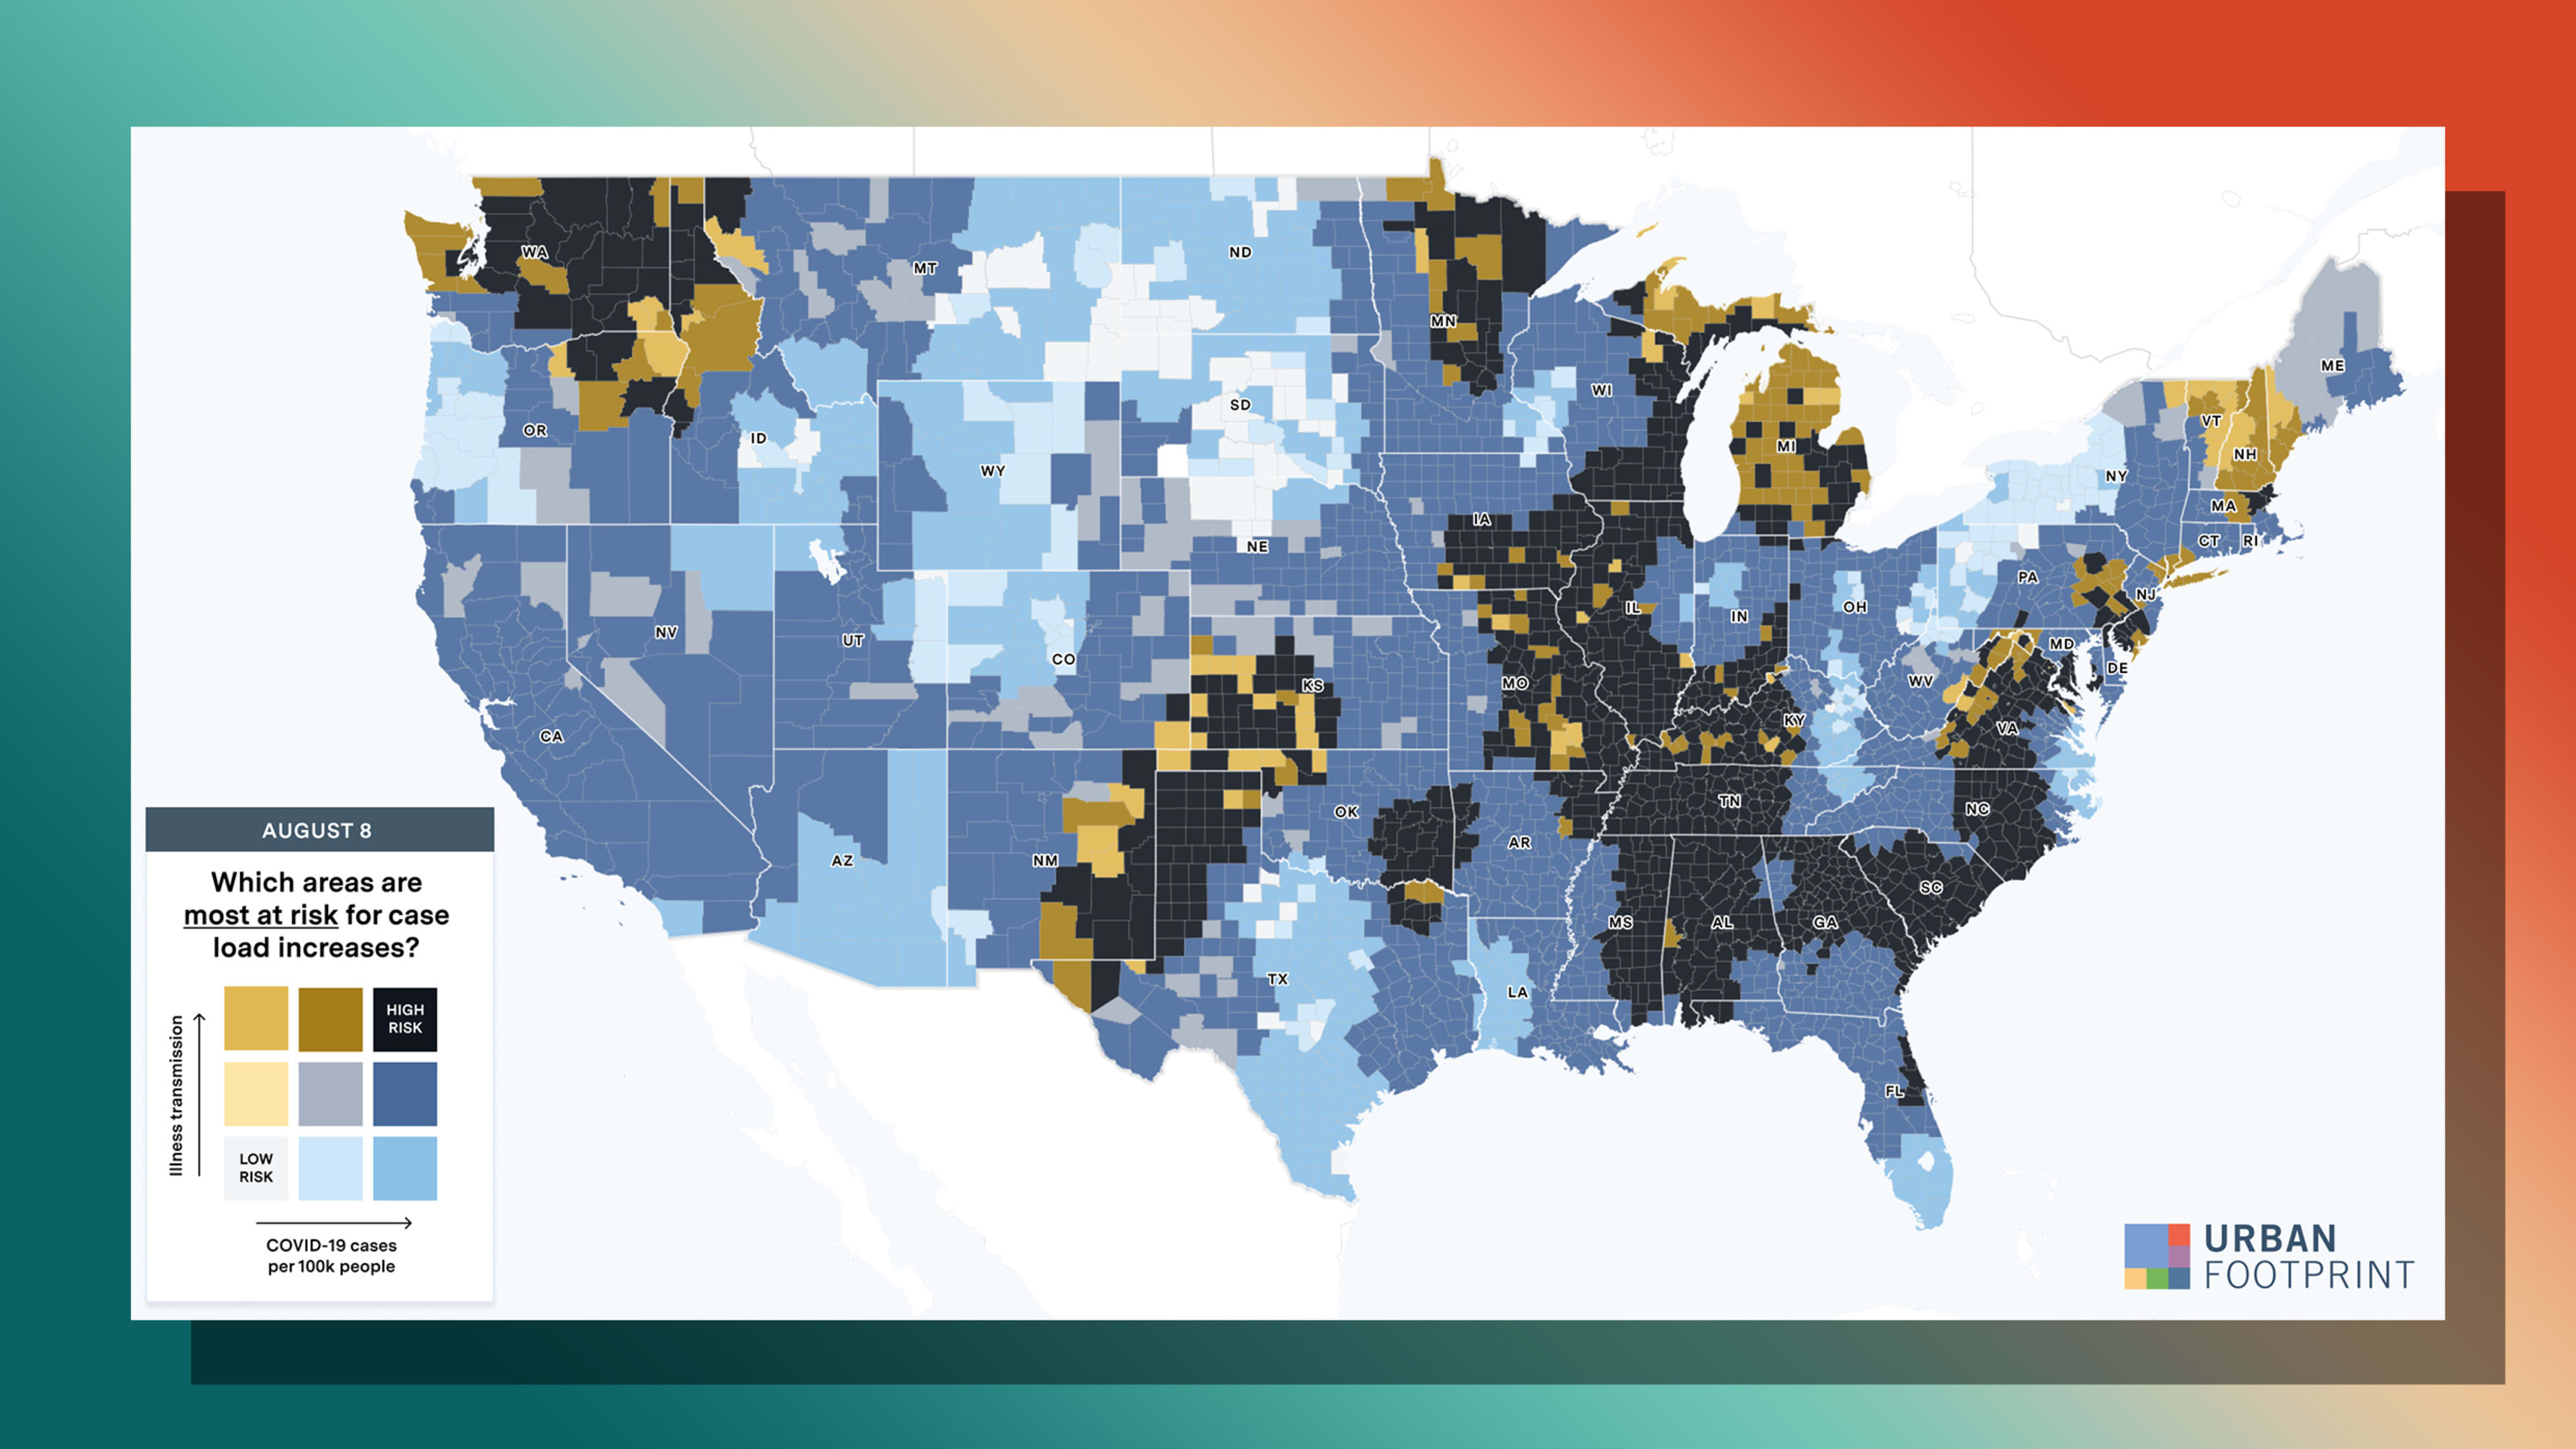
According to Urban Footprint, which is combining economic data and information from connected thermometers, areas of Michigan, Missouri, Illinois, Texas, and Washington are heading into dangerous territory.
Using smart thermometers that collect data about where people have fevers, it’s possible to estimate how many of those fevers might be due to COVID-19—and predict hotspots before patients go to the doctor for coronavirus tests. A new analysis uses that data to map out where cases may soon spike.
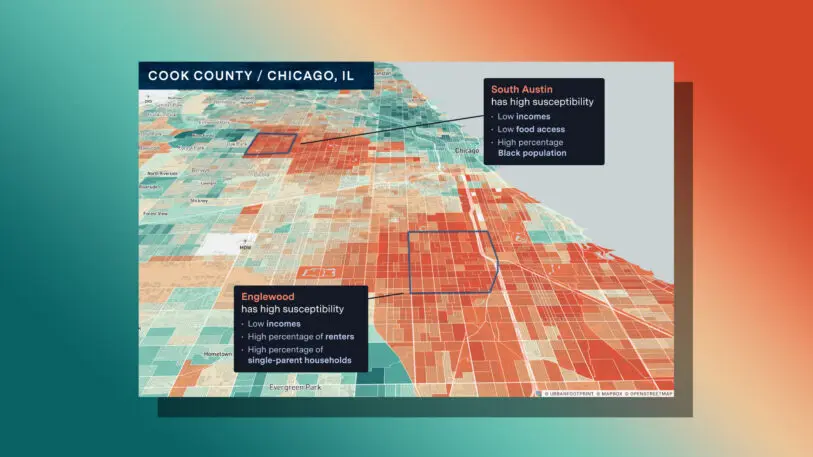
Areas in five states may be particularly at risk in the next two to three weeks: Michigan, Missouri, Illinois, Texas, and Washington. The analysis combines fever data with data about how much people in those areas are moving around, potentially spreading the virus. It also looks at how vulnerable they are because of underlying factors such as lack of access to healthcare, unemployment, and eviction risk.
[Image: courtesy UrbanFootprint]UrbanFootprint, a company that makes urban planning software, partnered with Kinsa, the smart thermostat company, to create what they call theCOVID-19 Watch List, building on work that UrbanFootprint had already been doing to help decision-makers such as state agencies prioritize where to send resources. “That’s really complex in this context because the situation is constantly changing,” says UrbanFootprint CEO Joe DiStefano. “What we’re finding is that everyone is constantly just a little bit underwater. Maybe after five months, people are just starting to tread water. So the idea of being able to look out ahead at where risk is likely to be spiking next, based on early indications from fever data—in this case from the Kinsa smart thermometer—data like that is really interesting, and I think really valuable.”
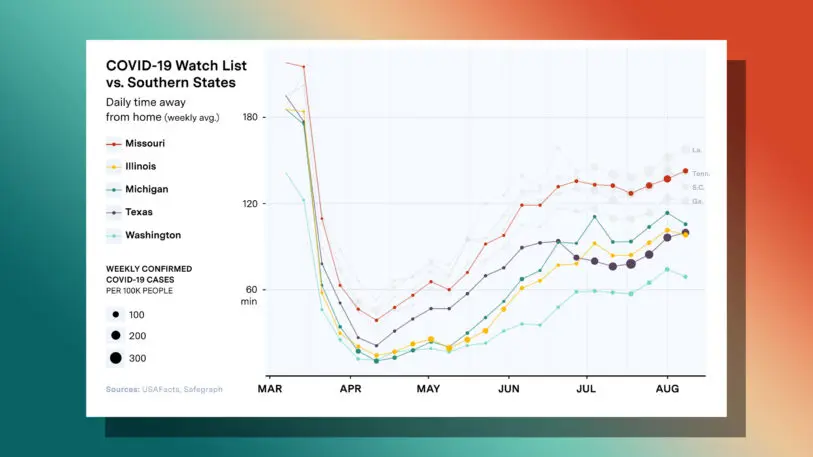
Kinsa used the same type of temperature data in early June to predict spikes in parts of the South and West, predictions that were later borne out in testing data. Combining that with movement data and an understanding of which neighborhoods are least prepared to handle an outbreak can help governments understand where to add new testing facilities and other resources on limited budgets.
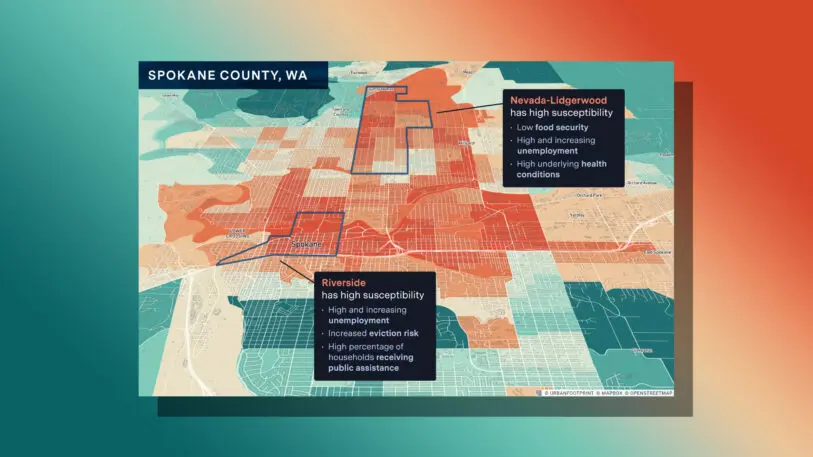
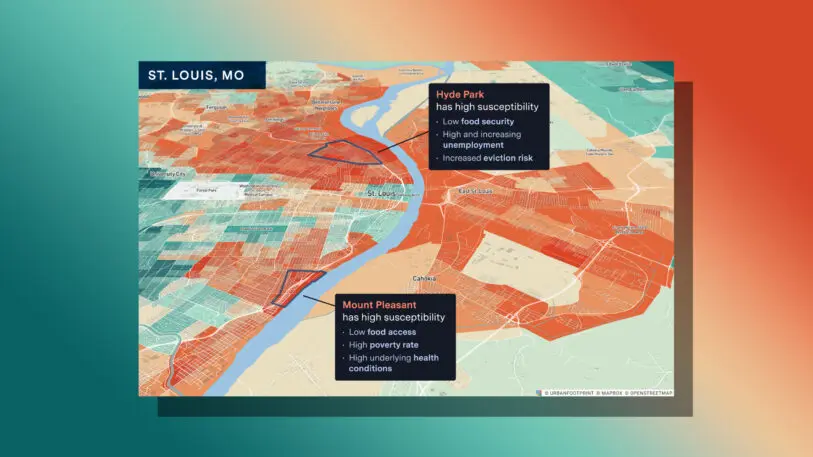
[Image: courtesy UrbanFootprint]“It’s not just looking at places with underlying sociodemographic and economic characteristics, it’s looking at those places that are experiencing ebbs and flows and increasing and decreasing levels of economic stress associated with job claims that are shifting every week, or associated with eviction risk that is incredibly high right now due to the collapse of federal protections or food security,” DiStefano says. “It’s all of these different dynamics coming together into a singular view of priority and risk across the landscape.” They plan to continue to add more data, including about economic activity and school reopenings, to help provide a detailed picture that can be used if cases grow even more in the fall.
[Image: courtesy UrbanFootprint]
The company is working directly with some governments, such as the state of Louisiana, to help them track changing factors, and it’s talking to federal agencies that are deciding where in the country to send resources, and working to understand which areas might be most at risk if an outbreak coincides with a disaster such as a hurricane or a wildfire. Some food relief organizations are also using the information to understand where to send food.
[Image: courtesy UrbanFootprint]The team plans to build a susceptibility index that anyone working on COVID relief can use to view the maps as they evolve. But because the maps could be a critical tool right away, it also began releasing them now, even before the tool is completely ready. The aim is to give officials a simple way to understand a complex set of factors—such as a rise in evictions and foreclosures—that could also spread the virus as more people are forced to live on the street. “The goal here is really to sort of find that signal through the noise when you have these multivariate challenges that, in and of themselves, are difficult to understand,” he says. “You pull them all together, and if we can just build a map, for example, that a decision-maker can squint at and say, we need to distribute resources here, otherwise the bottom will drop out.”
Recognize your brand’s excellence by applying to this year’s Brands That Matter Awards before the early-rate deadline, May 3.
A refreshed look at leadership from the desk of CEO and chief content officer Stephanie Mehta