By 2045, Sweden plans to cut its emissions to net zero. A new digital visualization shows exactly what it’s doing to reach that goal—and is designed to help policymakers move faster to fill in gaps in the current plan and make sure it actually succeeds. It’s also fully open to the public, so anyone can hold the government accountable.
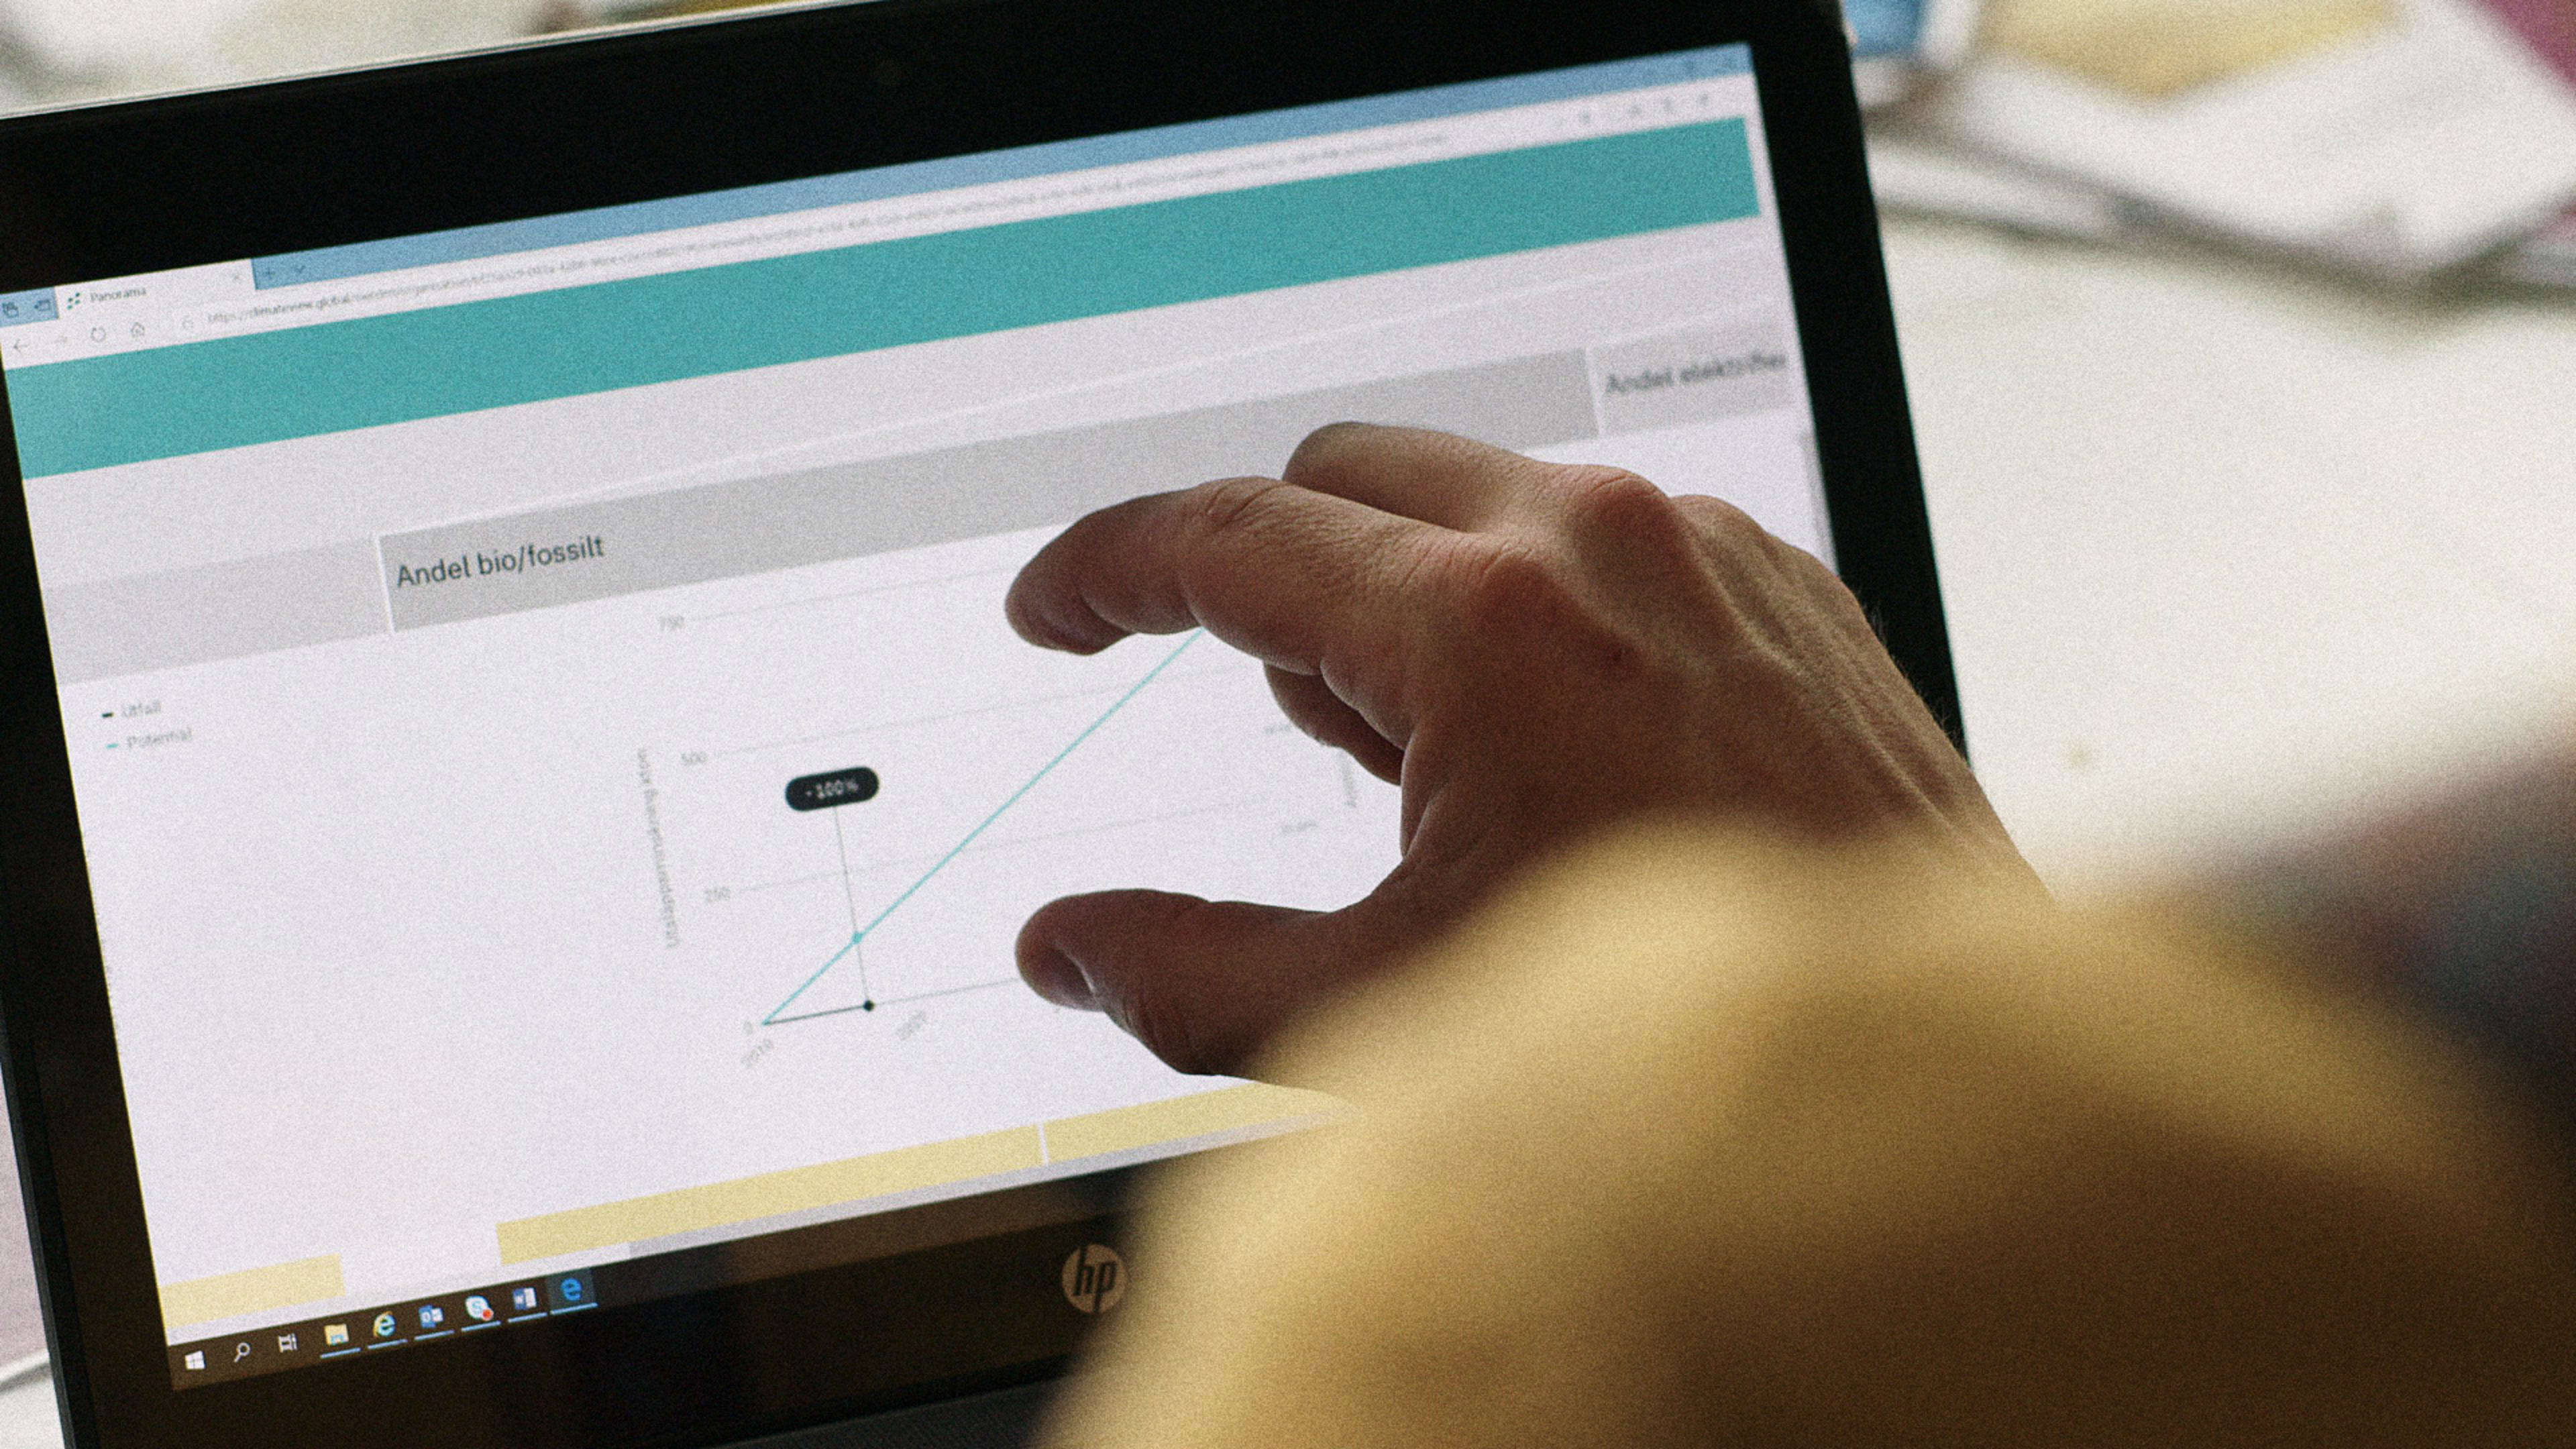
“The tool is a catalyst to change the way you work,” says Tomer Shalit, CEO of ClimateView, a Stockholm-based startup that developed the new dashboard for the Swedish Climate Policy Council, an organization tasked with making sure that the country’s policies are in line with its goal to become carbon neutral.

A typical government climate report might be 2,000 pages long, take months to complete, and could be outdated by the time it’s published. Shalit started by taking a single report—a giant tome about transportation policy—and translating the data into 6.5-foot-long poster that illustrated emissions from every type of transportation and all of the policies in play. He started approaching government officials with the prototype, and the feedback was immediate: Everyone saw the value in a tool that presented the big picture and made a complex issue more manageable. Vattenfall, a large energy company that Shalit was working with, decided to help support a full digital version of the tool.
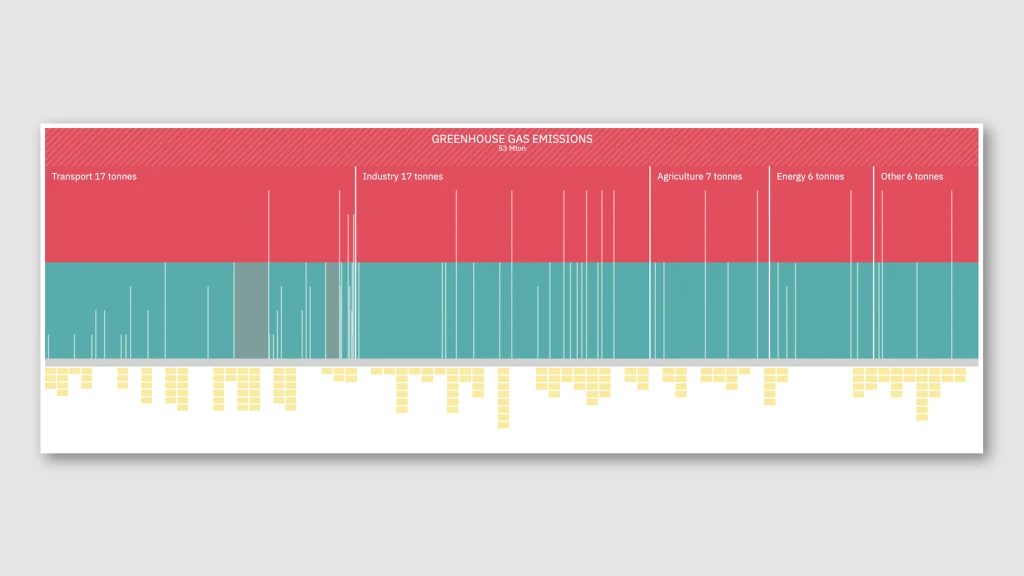
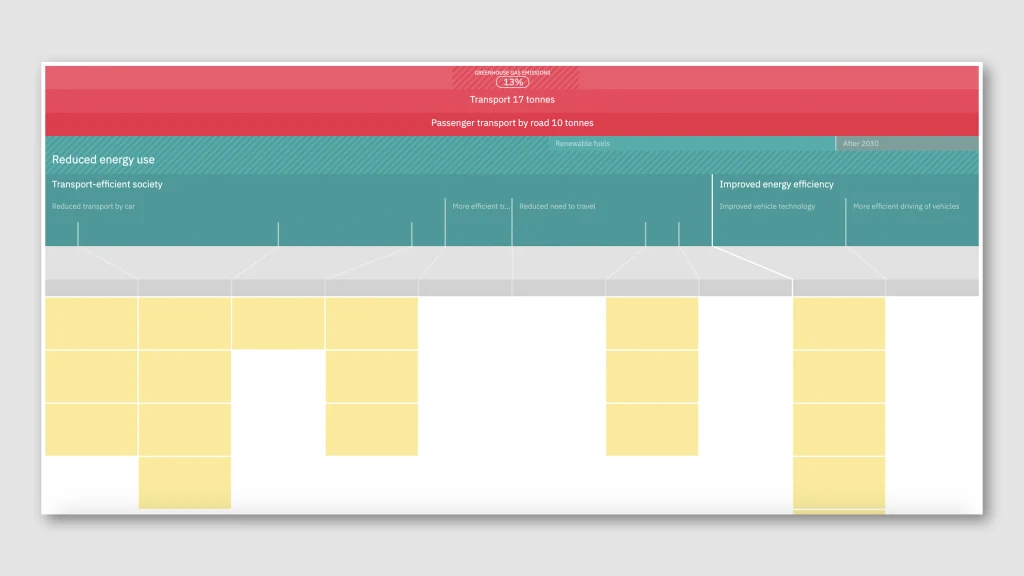
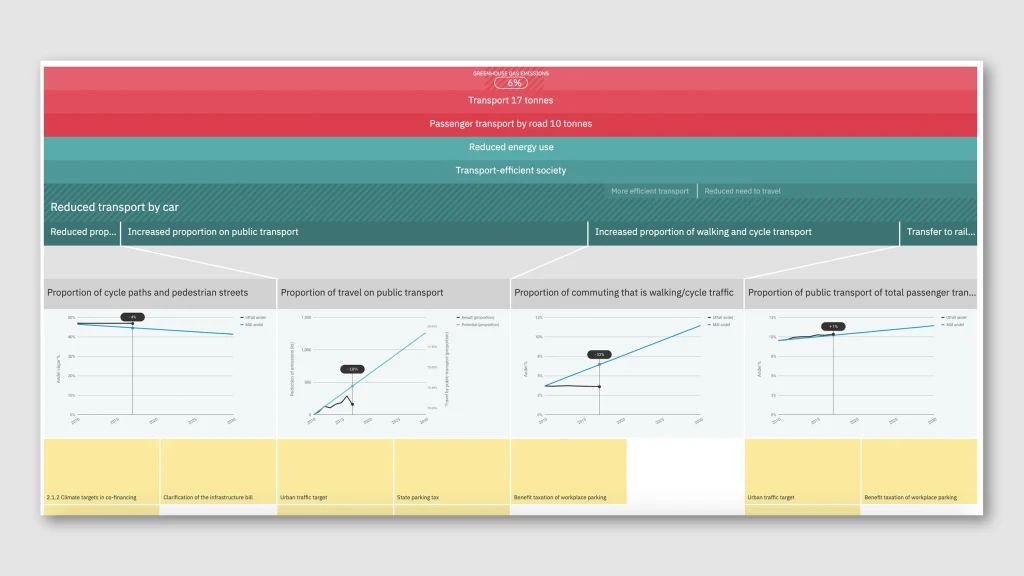
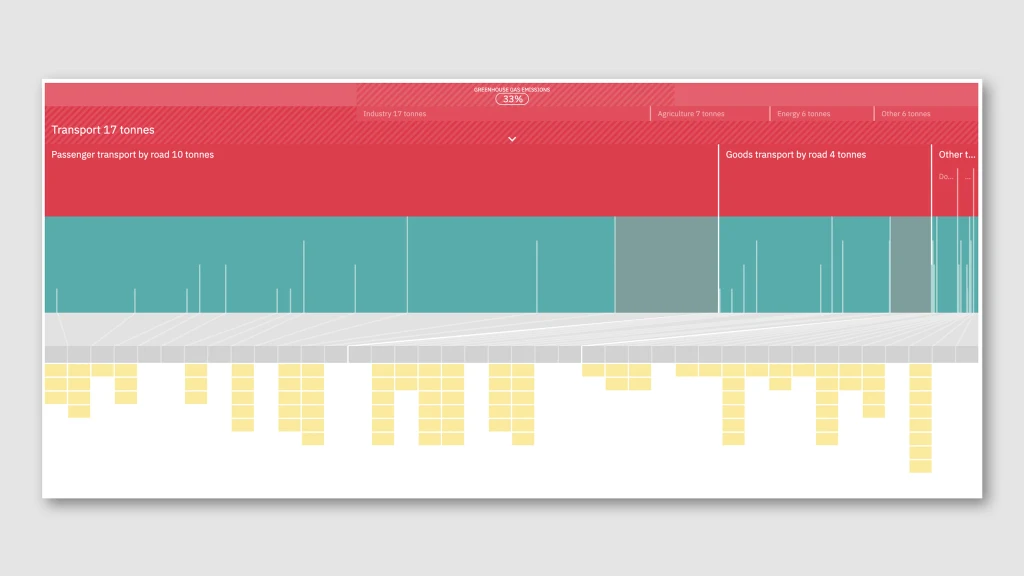
The digital dashboard, which includes all of the details from every Swedish climate report, lets anyone dive into the details of emissions across the economy, what policy is in place to address it, and how far the country is off track from meeting its 2045 goal. If you look at the emissions from cars, for example, you can see how much different approaches might cut those emissions–not just shifting to electric cars, but improving bike and pedestrian paths and public transportation–and see small charts about progress and which policies the country already has or plans to implement. It also lets nonprofits and others give feedback and propose new solutions. For government agencies that might not have worked in a coordinated way in the past, it makes it easier to understand the problem and work together.
As the startup developed the dashboard with government feedback, Shalit says that officials began to realize that the tool could help them work differently. “I went from climate anxiety to then suddenly feeling that people at all levels in government are prepared to act entirely new ways and just cut a lot of red tape and just make things happen,” he says.
The startup is now in conversation with other countries and cities that want to create road maps of their own. “It’s only if we make this global this will actually make a difference,” says Shalit. “The reason we get up in the morning is because of making an impact on the climate. And, of course, Sweden when it comes to CO2 is about 1% [of global emissions]. But Sweden in the form of showing how a nation can transition could be a helpful example for the world.”
Recognize your brand’s excellence by applying to this year’s Brands That Matter Awards before the early-rate deadline, May 3.
