Imagine if you were to visualize all of humanity’s connections. It’s a nearly impossible challenge, and two dimensional graphs certainly wouldn’t be up to the task. Even a network graph, a type of visualization that maps out connections in a network, isn’t up to such a large-scale project–since it can’t show how relationships change over time.
“[The network graph] is the diagram of our time,” says Lisa Strausfeld, a senior research fellow at The New School and the founder and principal of design studio Informationart. “We’ve seen this diagram for neural networks, social networks, organizational structures. I’ve found these diagrams almost unintelligible. They just convey connectivity and complexity.”
That’s why Strausfeld is creating an alternative: an early-stage prototype for a three dimensional data visualization that she hopes will create a new paradigm in the data world–one she’s been exploring since her time at MIT Media Lab in the 1990s.
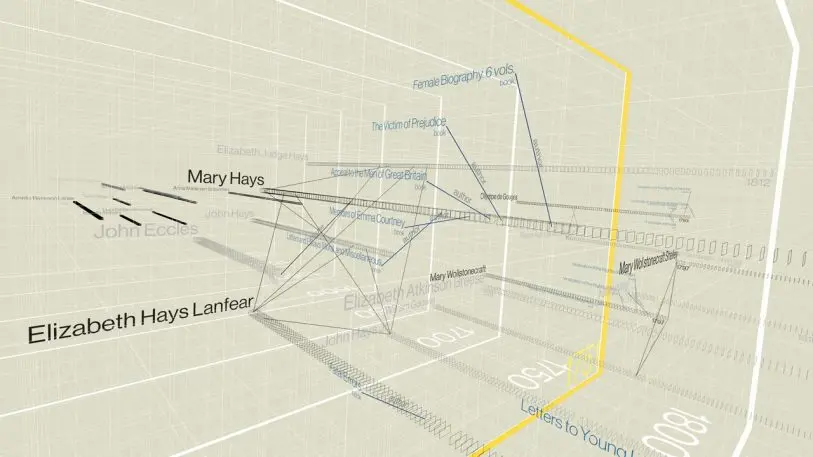
The prototype aims to demystify networks by allowing you to explore them virtually. To use it, you put on a VR headset and enter a three-dimensional timeline that is minimal and neutral on purpose–a counterbalance to more cinematic or illustrative VR experiences. Historically important women’s lives, drawn from a women’s history project at the New School, are visualized along the X axis. Each woman’s life stretches through the decades, represented by a long series of rectangles that symbolize years. Faint lines drawn between the women signify connections–friendships, correspondences, influences through the years.
Using handheld VR navigators, you can zoom through the space, changing your perspective or flying through time at the click of a button to explore the nuance of the networked relationships between luminaries like the 19th-century writer Mary Hays and her sister, novelist Elizabeth Hays Lanfear.
It feels like a rudimentary version of what Wikipedia might be like in virtual space, where you can visually see all the connections between human lives and the knowledge that civilization has collected over time.
“It’s almost like Google Earth for knowledge,” Strausfeld says.
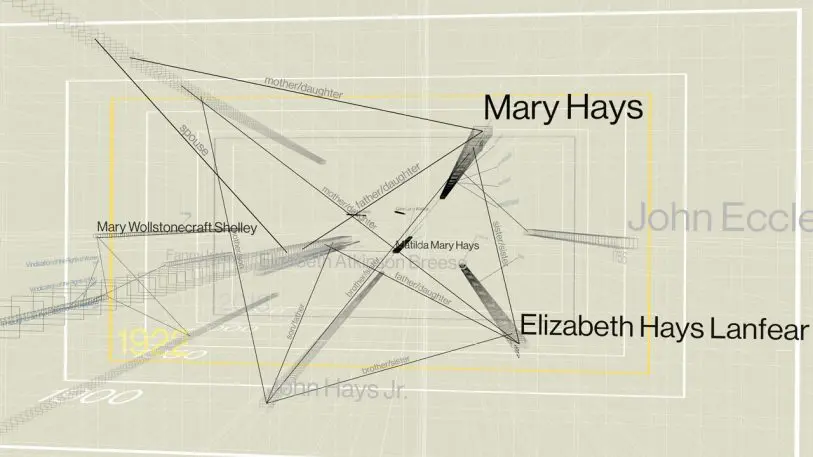
The prototype uses data from a women’s history project at the New School called The New Historia, which was inspired by a Hays and her 1803 Female Biography, a six-volume collection that recounts lives of hundreds of women. Today, New School professor Gina Luria Walker is creating the modern version of Hays’s work along with hundreds of scholars around the world, and it is these connections between notable women that Strausfeld’s prototype lays out in VR. For Strausfeld, it’s already led to epiphany: While in VR, she realized Hays was a direct contemporary of the legendary feminist Mary Wollstonecraft.
The genius of Strausfeld’s relatively simple prototype, which she worked on over the summer with the Portland-based studio Glowbox, is that it’s all built on the back of a Google spreadsheet, which would in theory allow anyone to participate in constructing it. “The users may be the builders of the space,” Strausfeld says. “It may be open [to the public], it may be academics, it may be people interested in seeing what they know in a new way.”
For Strausfeld herself, the project is a return to the past. Her thesis at the MIT Media Lab also focused on immersive 3D environments and how they can enhance understanding. “Actually before the web started, really, I thought, ‘The screen is a space,'” she says. “For me, it was always a space. It was a space you can enter.”
But after graduating, while working at Pentagram for years, she watched the screen become something else entirely. “The screen became a page,” she says. “The world got flatter and flatter and flatter because of monetization and web ads and banner ads.”
With VR, she sees the potential to return to her vision of the screen as a portal to another world–one where knowledge itself can find a visual form. “After being kind of stuck for a while, design-wise, and living inside not just the screen, but the browser for so long, I feel completely liberated,” she says. “I’ve been waiting for this moment to push through and I feel like we’re ready for it.”
Strausfeld is hoping to turn her prototype into a full-blown research project, where she can continue to develop her time-based network graph into either a research or educational tool for people to use, or as a large-scale platform to make connections between people’s contributions to knowledge as its developed through the course of human history.
“All the stuff that we know now lives in pages or tables, sometimes in databases. Just actually having that exist in a world that you can inhabit?” Strausfeld says. “I feel like we’ve needed this extra dimension for a long time.”
Recognize your brand’s excellence by applying to this year’s Brands That Matter Awards before the early-rate deadline, May 3.
